A Chart that Says 1,000 Words
Posted By : Armada Corporate Intelligence | Date : August 21, 2025Although not many of us give it much thought on a daily basis, but the US farmer is still under tremendous pressure and has been since the pandemic and the subsequent surge in input prices. Farm Bureau released insights from the latest August World Agricultural Supply and Demand Estimates (WASDE), and the gap between input prices and selling prices are extreme.
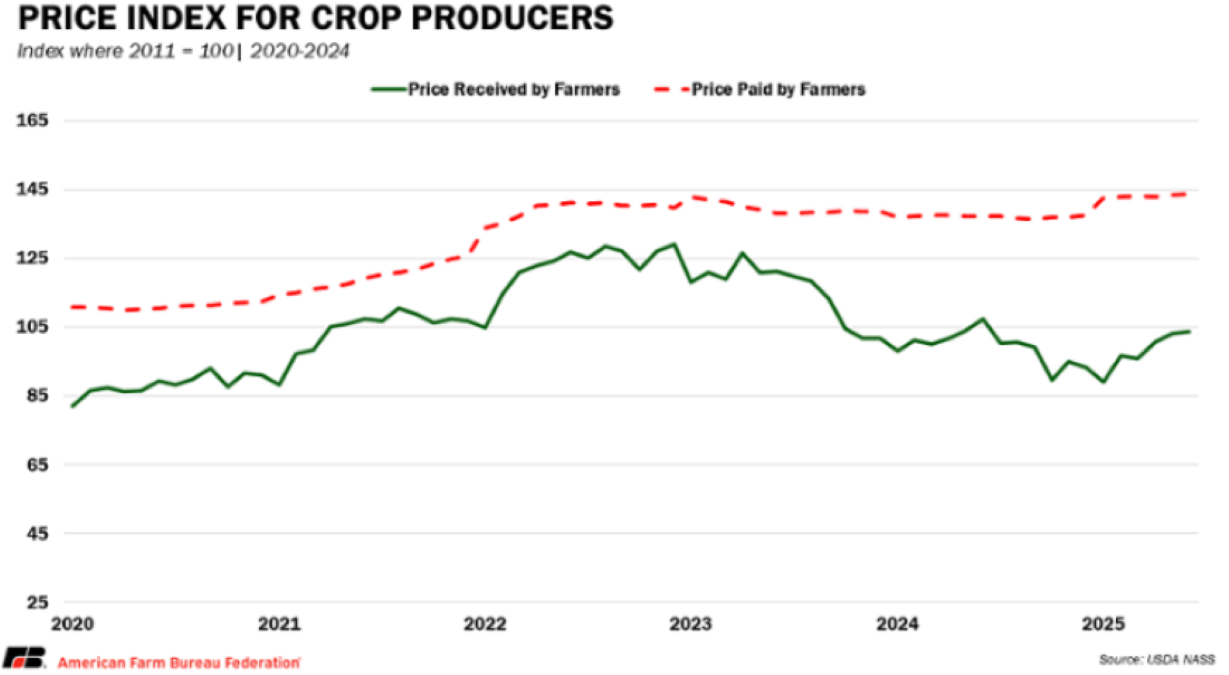
The chart below from Farm Bureau illustrates just how challenging this environment has been for the farming community. The prices paid by farmers still exceed those being received from commodity sales, and this year’s strong harvest season is going to make conditions even worse.

Corn is expected to hit a record yield along with a record acreage planted. The combination will put tremendous commodity price pressure on farmers trying to get sufficient prices for their crops. Supply growth is expected to significantly outpace demand growth, leading to an estimated 62% Y/Y growth in corn ending stocks. That condition is what is helping fuel the conditions shown in the graph below. Wheat and soybean inventory will not be as aggressively overbuilt by the end of this harvest season as we see in the corn complex, but some of the similar pressures and scenarios could be at work there as well.
Costs remain near 2023’s historic highs and are 30% higher than they were in 2019. This, despite softening less than 0.8% from last year’s levels. When stripping out government payments, the year-over-year percent change is expected to be down about 0.5%-2.7% based on different estimates.
But when you include nearly $42.4 billion in government payments that were/are being paid out this year, farm incomes will be up nearly 30% Y/Y. Again, remember that the government payouts this year are designed to cover losses from 2023 and 2024.
There are still questions about the impact of reduced US exports of grains being offset by new trade agreements (in which agricultural product purchases by foreign entities is a core part of many of the deals being struck). Whether those governments will uphold their end of the agreements (which should be legally ratified this fall) is another story.
Until then, the $125K to $250K that the average farm may receive will help offset another rough year for base farm incomes. That could help with some new equipment purchases (especially when coupled with tax benefits coming out of the OBBBA), but the ongoing pressure from the gap between input costs and selling prices is going to continue to provide some headwinds for farmers. – KP
