Tariff Pressure is Showing
Posted By : Armada Corporate Intelligence | Date : August 1, 2025The Fed’s favorite measure of inflation was released, and we saw it inch up. But once again, diving into the data to try and understand where tariff pressures were showing up and where they were still docile, revealed quite a bit.
For starters, I still love the Trimmed Mean PCE (average inflation) reading from the Dallas Fed. It strips off the highs and lows and averages the middle. This month for instance, eggs were down 60% and household linens were up 90%. The average inflation figure allows us to strip out the highs and lows (because many of those could be simply data anomalies on a specific month) and get to “real” street level inflation. It also incorporates real world inflation that comes through food and energy, if that is applicable in a common month unlike core inflation readings that strip those out.
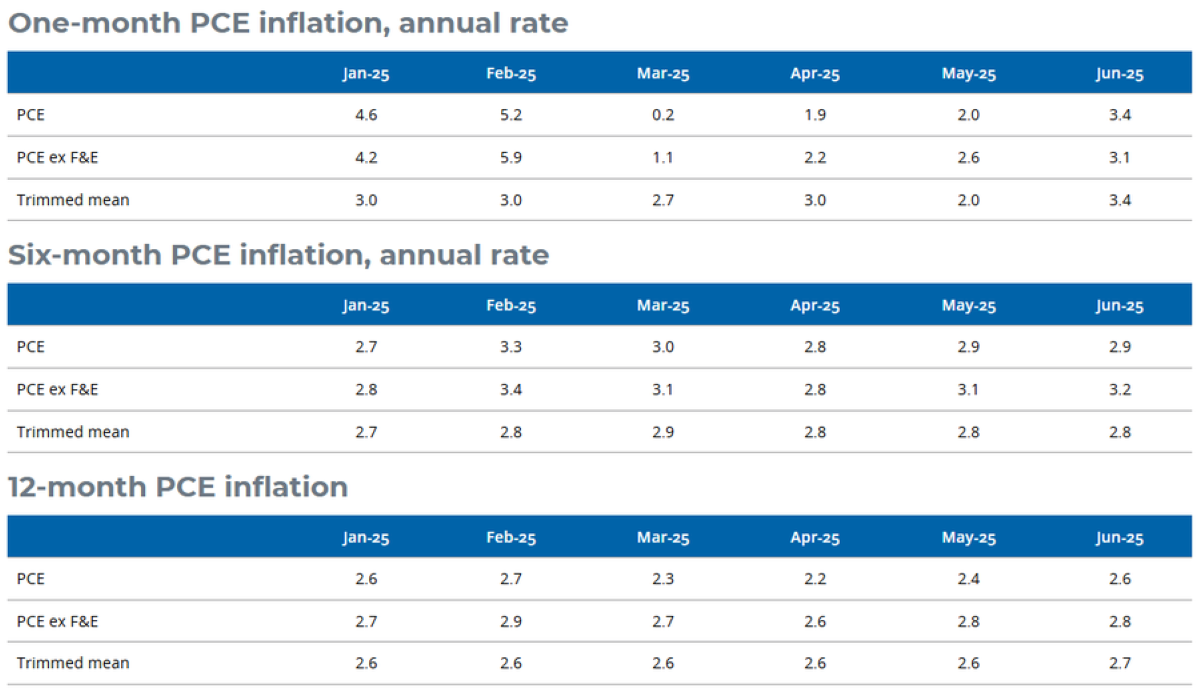
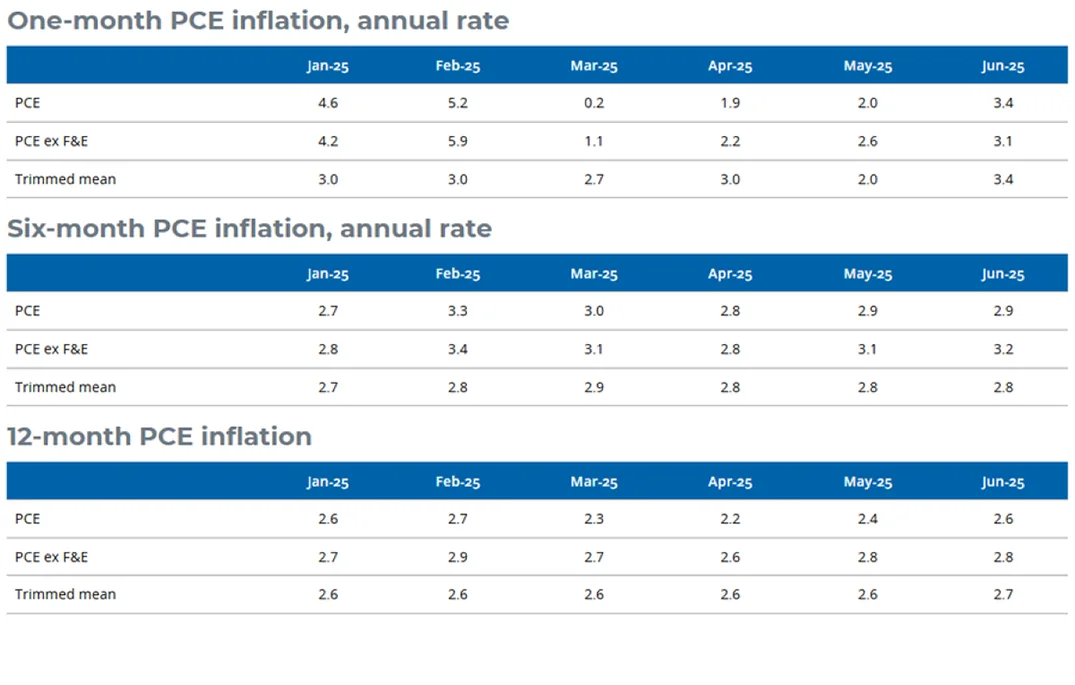
The chart below shows average inflation and it came in at 2.7%, slightly below the core PCE reading of 2.8% that caught so many headlines. Now, on a 30-day basis, we have seen average inflation move up sharply by 3.4% and 6-month inflation was up 2.8%, hotter than many would like to see and above the Fed’s 2% target rate.

But we still have to understand 1) what is normal inflation driven by consumption, and 2) what is based on the added tariff impact? Again, tariff impacts (once fully levered) should be a one-time adjustment for most supply chains and then once that price adjustment has taken place, future hikes should be back in line with market movement.
We did an additional, deep dive into the inflation data and found a couple of very interesting items.
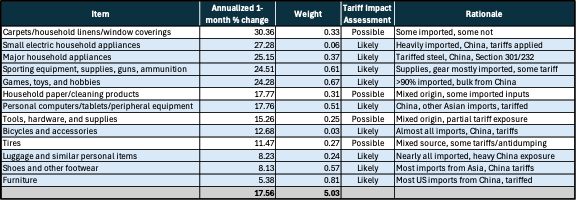
The table below includes the items in this month’s inflation data that show 1) that the sources for those products and tariffs being applied meant that they were subject to tariff pressures through June and 2) that there was at least a mild tariff impact.

A couple of key points coming out of the chart:
- The average change in these items was 17.6%. This would have been with most of these countries sitting on a 10% base tariff plus additional Section 232 tariffs on aluminum and steel. Since most would have been exposed to at least 60% tariffs on many input prices, the 17.6% average is a bit of an indication of what we might expect in these industries with Section 232 exposure.
- Also note that most of the new tariff levels come in at 15-20%, which would add another 5% to most of these prices in the coming months once reorder activity starts (once firms have fed off of these existing levels).
- Note that the items with low tariff impact rates have no exposure to Section 232 tariffs.
- Collectively, these only accounted for 5% of the total inflation contribution – based on their weighting. This is important because much of the inflation pressure at this point comes from energy and services cost escalation.
- Services costs will come down, but it will likely coincide with an adjustment in wages (which means the labor market would have to invert from current levels).
- AI replacement in some service sectors could also pull some of that inflation down, but that is likely a longer-cycle.
The overall impact from tariffs on inflation was still muted in June at a macro level. We’ve shown that when you dive a little deeper, there are some secular and product-specific inflation pressures starting to build in some sectors. The Fed and others have reasons to worry that the tariff impact is still coming, especially as copper tariffs are added into Section 232 pressures. But just writing off the impact of tariffs and saying that they have no impact on inflation does not tell the full story.
